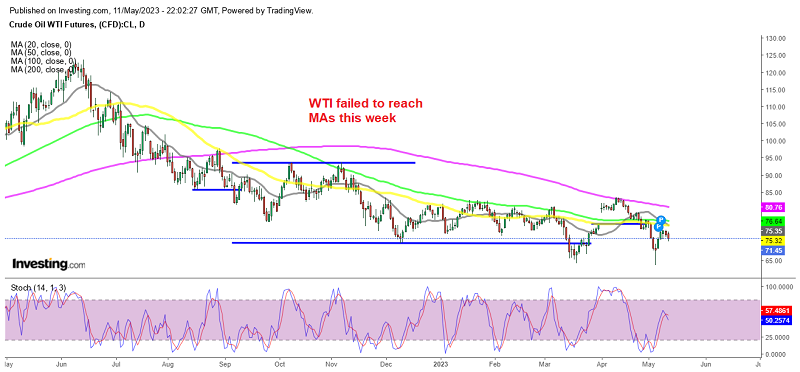
Crude oil continues the bearish momentum that began last June, with sellers still in control despite a bullish gap that saw prices rise above $80 in early April. The 200 SMA (purple) stopped rising last month as buyers pushed the price above the traditional resistance indicator of the 100 SMA (green).
However, as selling pressure intensifies, smaller moving averages seem to be resuming their work. Last week saw a plunge towards $64 as banking problems resurfaced, but JP Morgan’s acquisition of First Republic Bank and a strong reversal in oil calmed fears and turned bullish. A signal hammer was formed.
A bullish reversal occurred, with US WTI crude rising close to $74, but buying pressure appears to have eased again. During US trading, oil prices fell as the US dollar gained momentum. This fall in oil prices coincided with a fall in stock prices. However, it is important to note that oil prices are currently in a correction phase.
The support level around 70.80 is being tested and its significance lies in the possibility of a new upside. In his WTI oil daily chart above, we can see that the market had an initial period of strong buying after the surprising OPEC+ production cuts, creating a gap in prices. However, by mid-April, the market had reversed and the price had dropped to a low of $64.
This support level around $64 is very important to watch if the price reaches this level again in the future. The price has now reversed and is targeting the $70 levels. If $70 is broken out quickly, last week’s lows will be the next target, after which it will head towards $60. However, we should keep an eye on the economic indicators over the next few days.
WTI
