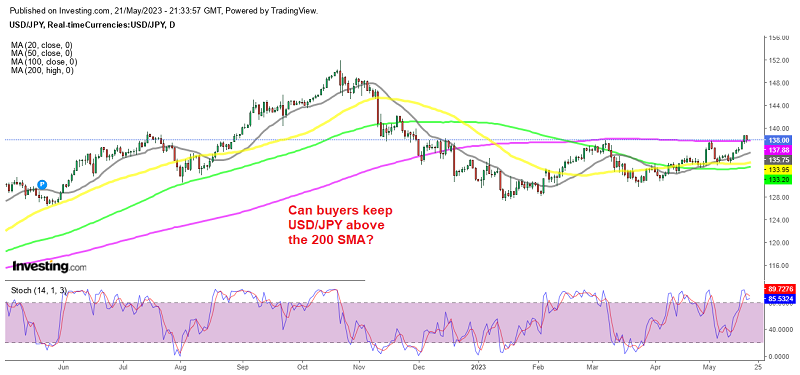
USD/JPY initially turned bullish earlier this year, but failed to break above the 200 SMA on the daily chart. Although the price has fallen, I recently retested this moving average without success. The pair moved further up and broke through the resistance zone around 138 where the 200 SMA is located.
The presence of the 200-day SMA has caused some hesitation among buyers. However, the overall trend suggests that the buying momentum will continue after the rebound of the smaller moving averages. The recent bullish momentum has lifted the highs, indicating that the pullback is likely to attract new buyers and strengthen the up move.
The pair experienced a strong rally last week, breaking the 200 SMA on the daily chart. The bullish move added momentum to the upside, pushing the price above the high of the year to reach 138.76. The previous high of 138.00 has now turned into support for the pair and the 200 SMA is also gaining strength. With current market sentiment trending upwards, the pair may break the 138.00 mark to make new year-to-date highs, with a possible short-term target of 140.00.
But on Friday, USD/JPY fell on news of Fed Powell’s remarks on bank lending cuts, the Fed’s final interest rate cut and US debt ceiling talks stalled. As a result, US yields and the US dollar fell.
USD/JPY It fell below the historical swing highs of March and May 2023, specifically 137.76 and 137.91. The pair rallied after reaching a low of 137.414. The price is currently trading between these levels at 137.83. Traders are now indecisive and weighing whether to push the price back above 137.91, which suggests a more bullish bias, or break below 137.76, which suggests a more bearish bias in the short term.
USD/JPY

