WTI oil
daily timeframe.
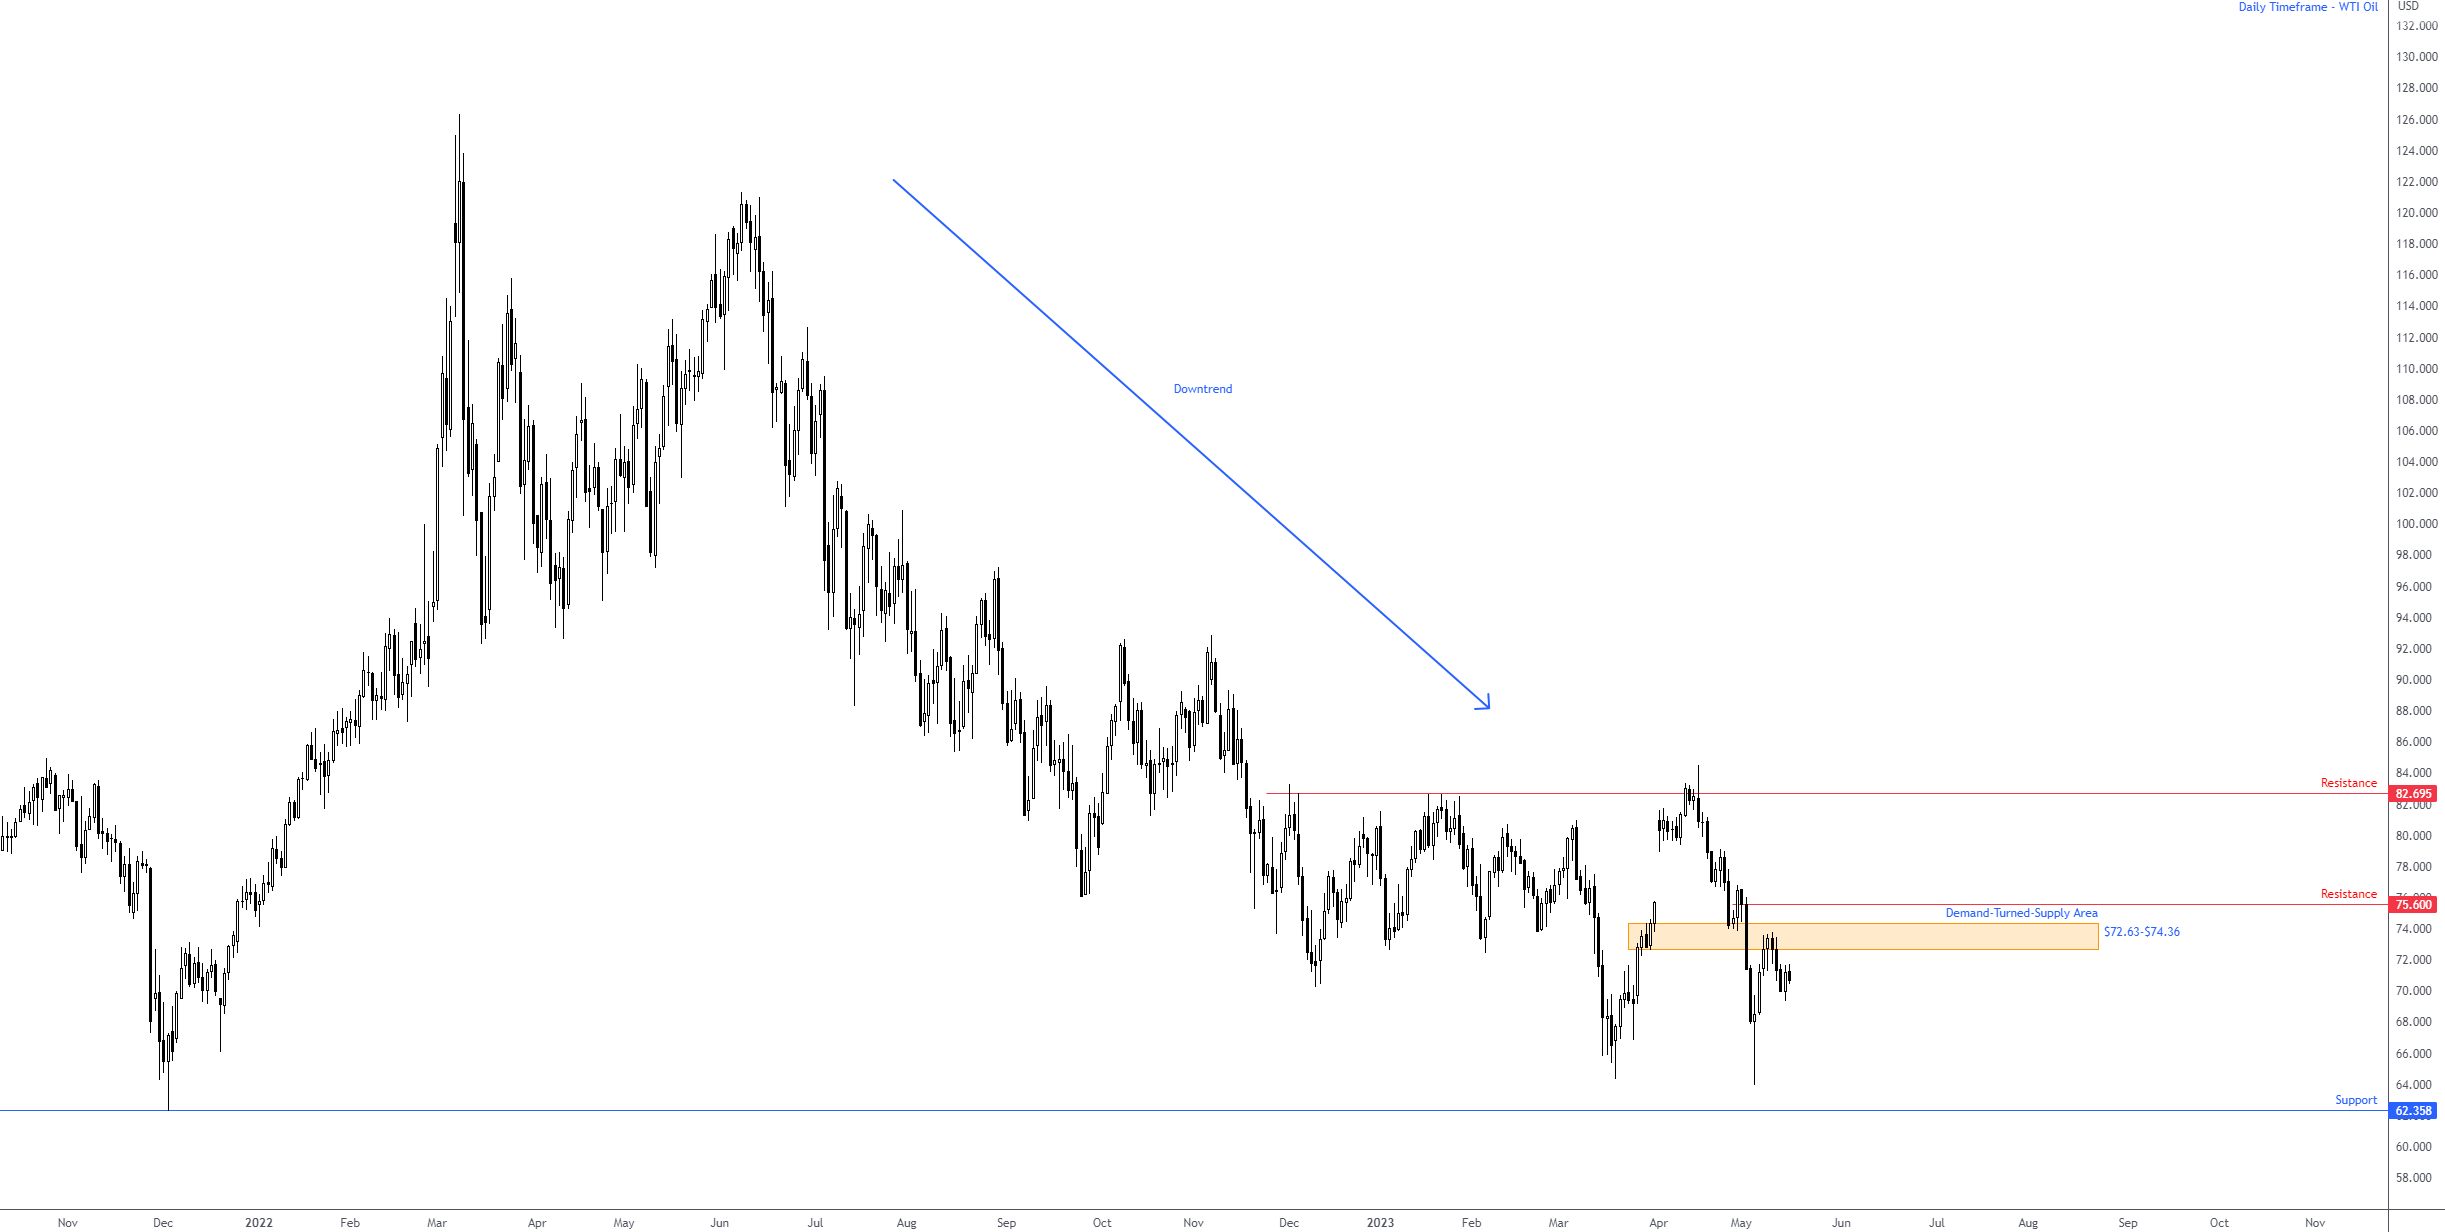
Crude oil prices have been on a downward trend since reaching $126.35 per barrel, and have cycled between lows and highs since March 2022.
I believe selling has risen from the $72.63 to $74.36 demand-to-supply zone as the unit renews the lower end of $63.94 (May 4), a move that reaffirms the market’s bearish bias. Note that there may be scenarios where As you can see, this really took shape, with sellers showing a pretty strong look out of the zone. The question is whether sellers have enough gas in their tanks to shake hands with support from $62.36 above $63.94.
Another important observation on the daily chart is the resistance at $75.60 just above $72.63 to $74.36. In fact, this is what I call the decision point formed from $72.63 to $74.36 before it dips, and thus whipsaws north of the aforementioned area (and consuming the stop) to $75.60. A move could be enough to trigger a stronger and more meaningful downside move. Time will tell. Either way, it’s still a bear market at the moment, and it’s trending towards new lows.
 XAG/USD
daily timeframe.
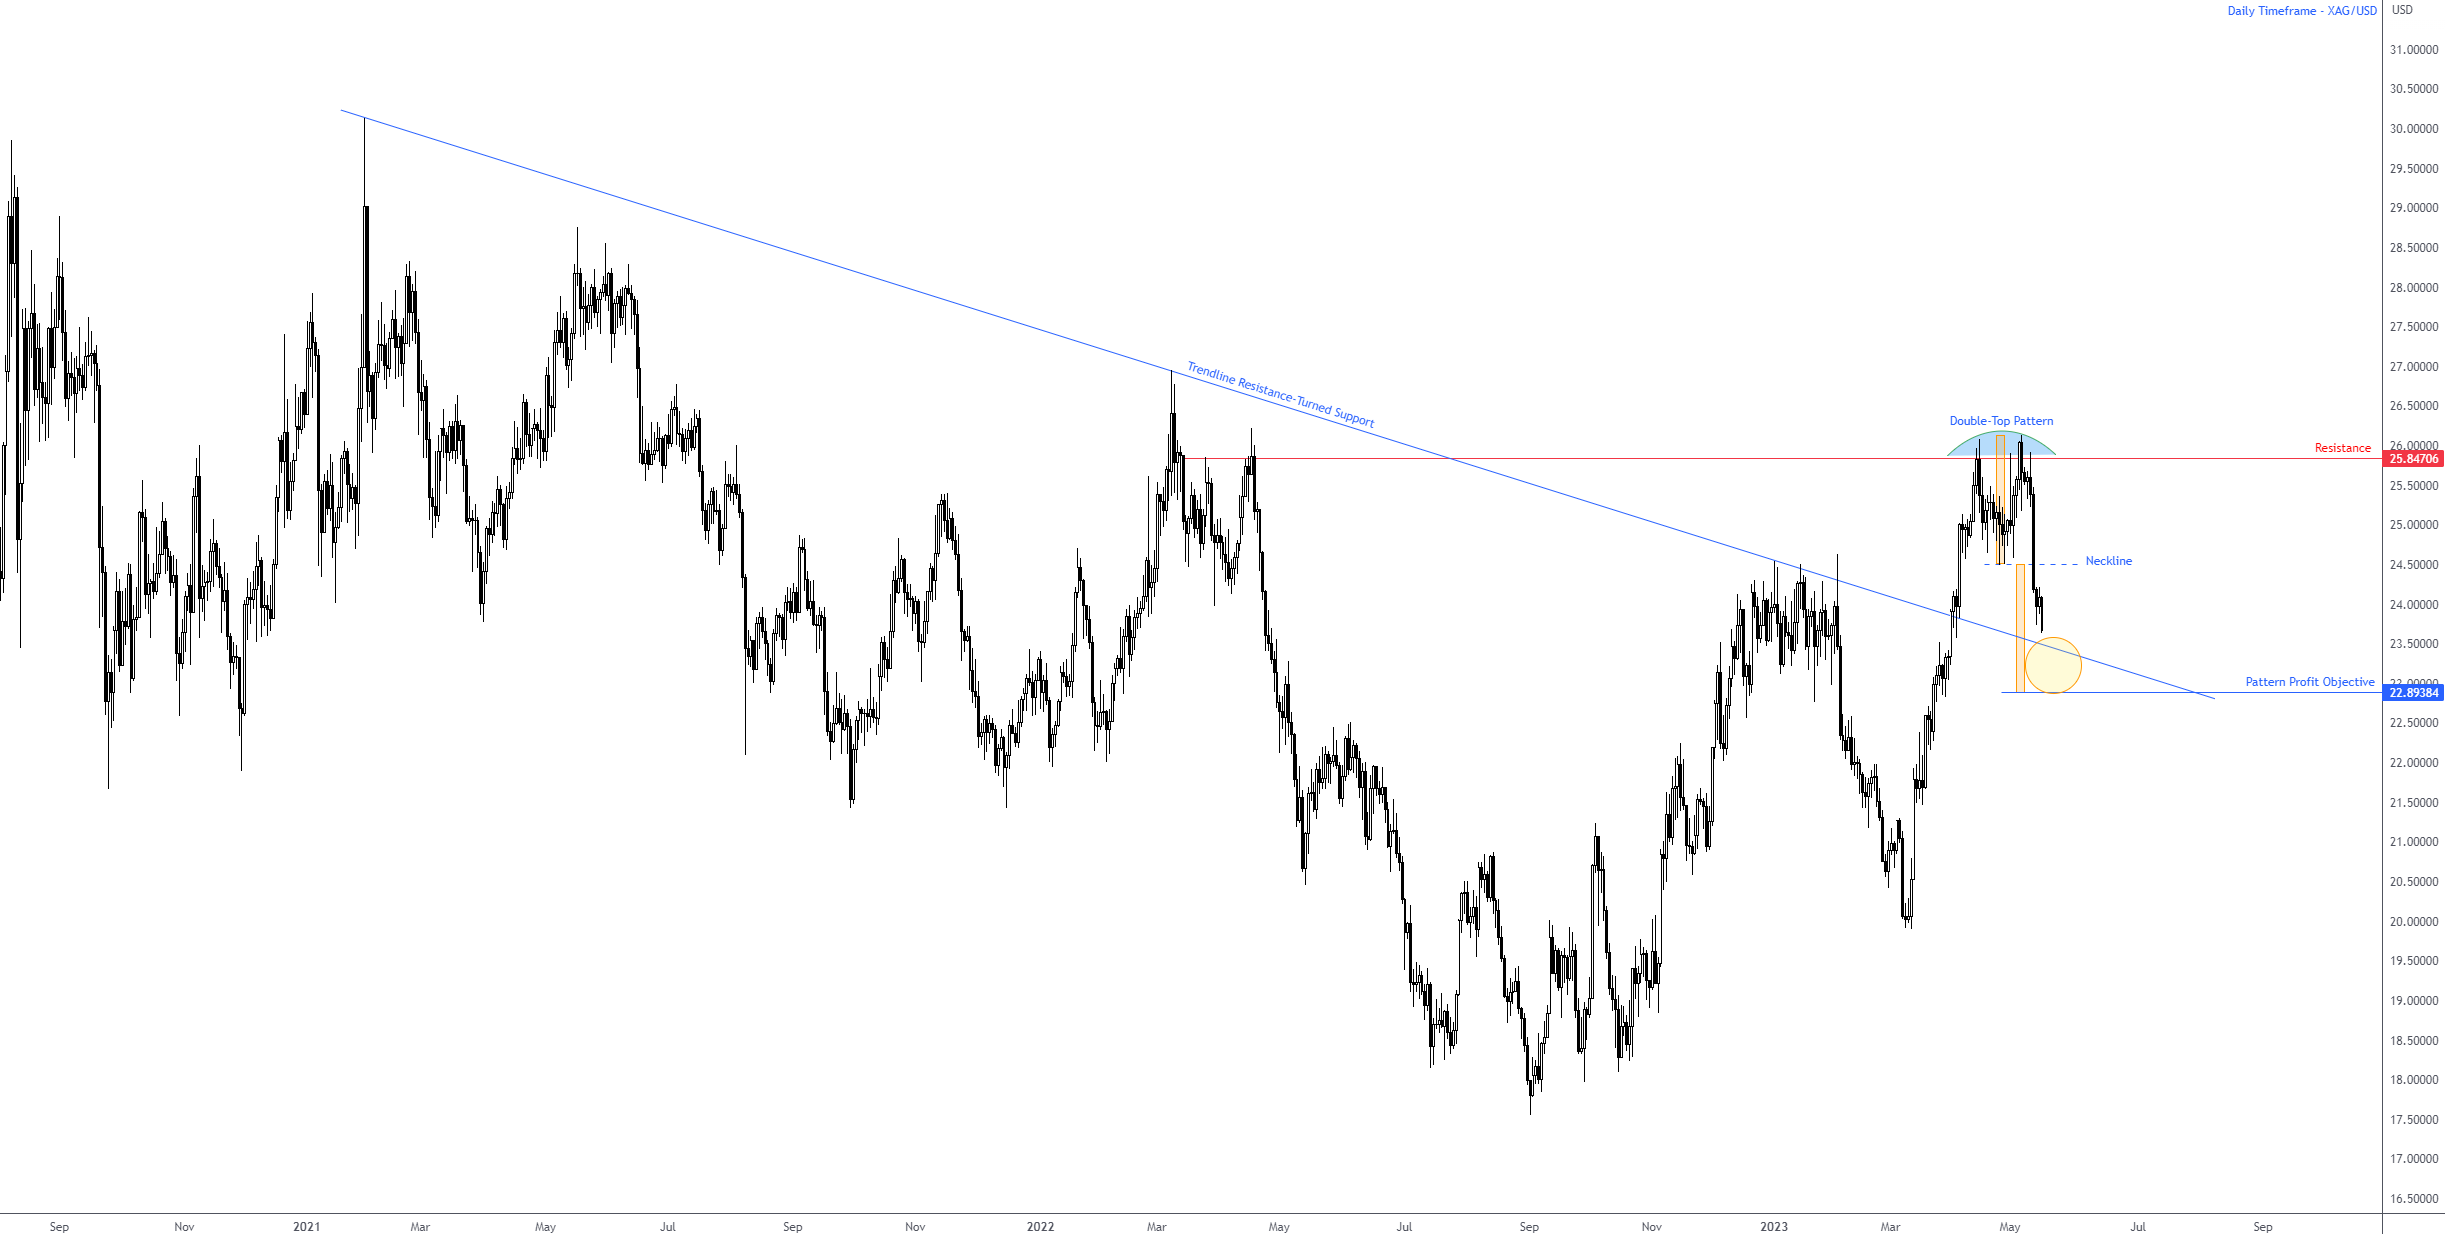
As previously mentioned, XAG/USD has explored the south side of the neckline ($24.51) of a double top pattern formed around resistance at $25.85. As can be seen from the chart, the sellers remain determined to explore deeper waters and test the strength of the nearby support that formed as the long-term trendline resistance turned to support from the $30.14 high. , followed immediately by a double top pattern. The target profit is $22.89. It is possible that the neckline retest could still unfold, but it is unlikely to happen before the aforementioned trendline support is touched.
However, I made it clear in my previous article that this market trend is similar to that of gold: heading north. Therefore, testing the space seen between the trendline support and the pattern’s profit target (circled) could be a sufficient technical floor to encourage short covering as well as dip buying. there is.
 Chart: TradingView
Last Week’s Report: Daily Report: GBP/USD Targets $1.25 Break … Read More
Disclaimer: The information contained in this article is for general advice only. Your investment objectives, financial situation or particular needs are not considered. FP Markets makes every effort to ensure the accuracy of the information as of the date of publication. FP Markets makes no warranties or representations with respect to the Materials. The examples included in this document are for illustrative purposes only. TO THE EXTENT PERMITTED BY LAW, FP MARKETS AND ITS EMPLOYEES WILL NOT BE LIABLE FOR ANY LOSS OR DAMAGE (INCLUDING NEGLIGENCE) SUFFERED IN ANY MANNER IN CONNECTION WITH ANY INFORMATION PROVIDED IN OR Omitted FROM THIS DOCUMENT. shall not be held liable for Features of FP Markets products, including applicable fees and charges, are outlined in the Product Disclosure Statements available on FP Markets’ website (www.fpmarkets.com) and should be considered before deciding to proceed with these products. need to do it. Derivatives may involve risk. Losses can exceed the initial payment. FP Markets recommends seeking independent advice. First Prudential Markets Pty Ltd trades as FP Markets ABN 16 112 600 281, Australian Financial Services License Number 286354.
Opinions are the author’s personal and do not reflect those of LeapRate. This is not trading advice.

